7 Amazon Brand Analytics Reports to Master in 2025
Category: Amazon brand analytics
Unlock Your Brand's Full Potential: A Guide to Amazon Brand Analytics
If you're an Amazon seller with Brand Registry, you are sitting on a goldmine of data that can transform your business. Amazon Brand Analytics (ABA) offers unparalleled insights directly from the source: real customer search and purchase behavior. Moving beyond guesswork, this powerful suite of tools allows you to understand precisely what customers are looking for, how they find your products, and what drives their purchasing decisions. From optimizing your listings with high-converting keywords to uncovering competitor strategies and fostering customer loyalty, mastering Amazon Brand Analytics is no longer optional; it's essential for sustainable growth.
This guide will walk you through seven critical reports within the ABA dashboard, providing actionable steps to turn raw data into your most valuable strategic asset. We will explore how to access these reports, interpret key metrics, and integrate these insights to boost your sales and brand presence. For instance, the Search Query Performance report gives you a granular look at impressions, clicks, click-through rates, add-to-carts, and conversion rates for every keyword related to your products. This information is a direct line into the customer’s mind, and it's available only to brands enrolled in the Amazon Brand Registry.
Throughout this listicle, we will cover the following key reports and how to leverage them:
- Search Terms Report
- Item Comparison and Alternative Purchase Behavior
- Market Basket Analysis
- Demographics and Geographic Insights
- Repeat Purchase Behavior Analysis
- Brand Performance Dashboard
- Search Catalog Performance
By the end, you'll have a clear, step-by-step roadmap for using these powerful tools to make smarter, data-driven decisions that propel your brand forward. Let's get started.
1. Search Terms Report
Understanding precisely what customers type into the Amazon search bar is the first step to mastering your sales strategy. The Search Terms Report, a cornerstone of Amazon Brand Analytics, provides this exact insight. It reveals the most popular search terms related to your products, showing which terms drive the most clicks and sales. This report helps you align your product listings and advertising campaigns with actual customer behavior, moving beyond guesswork to data-driven decisions.
For brand-registered sellers, this capability is elevated by the Search Query Performance report. This more granular tool offers a complete view of your customer’s journey from search to purchase. It doesn't just show you the search term; it provides a detailed breakdown of impressions, clicks, click-through rate (CTR), add-to-carts, and total orders for each specific keyword and ASIN. This level of detail is crucial for identifying your most valuable keywords and pinpointing weaknesses in your sales funnel.
How to Use the Search Query Performance Data
The power of this report lies in its actionable metrics. By analyzing the data, you can uncover specific opportunities for optimization:
- High Impressions, Low CTR: If a keyword generates many impressions but few clicks, your product is visible but not compelling enough. Your main image, title, or price might not be attractive compared to competitors in the search results. Consider A/B testing your main image or refining your title to include more persuasive language.
- High Clicks, Low Conversions: When shoppers click but don't buy, the issue likely lies on your product detail page. Review your bullet points, product description, A+ Content, and customer reviews. Is the information clear? Does it address potential customer questions or concerns? This pattern could also signal a pricing or shipping issue that makes customers hesitate at the final step.
- High Add-to-Carts, Low Orders: This is a critical signal. A customer wanted your product enough to add it to their cart but abandoned the purchase. This often points to unexpected shipping costs, long delivery times, or a final price that felt too high.
The following bar chart illustrates how you can compare the click share and conversion share for your top-performing search terms, helping you quickly identify which keywords are truly driving sales versus just traffic.
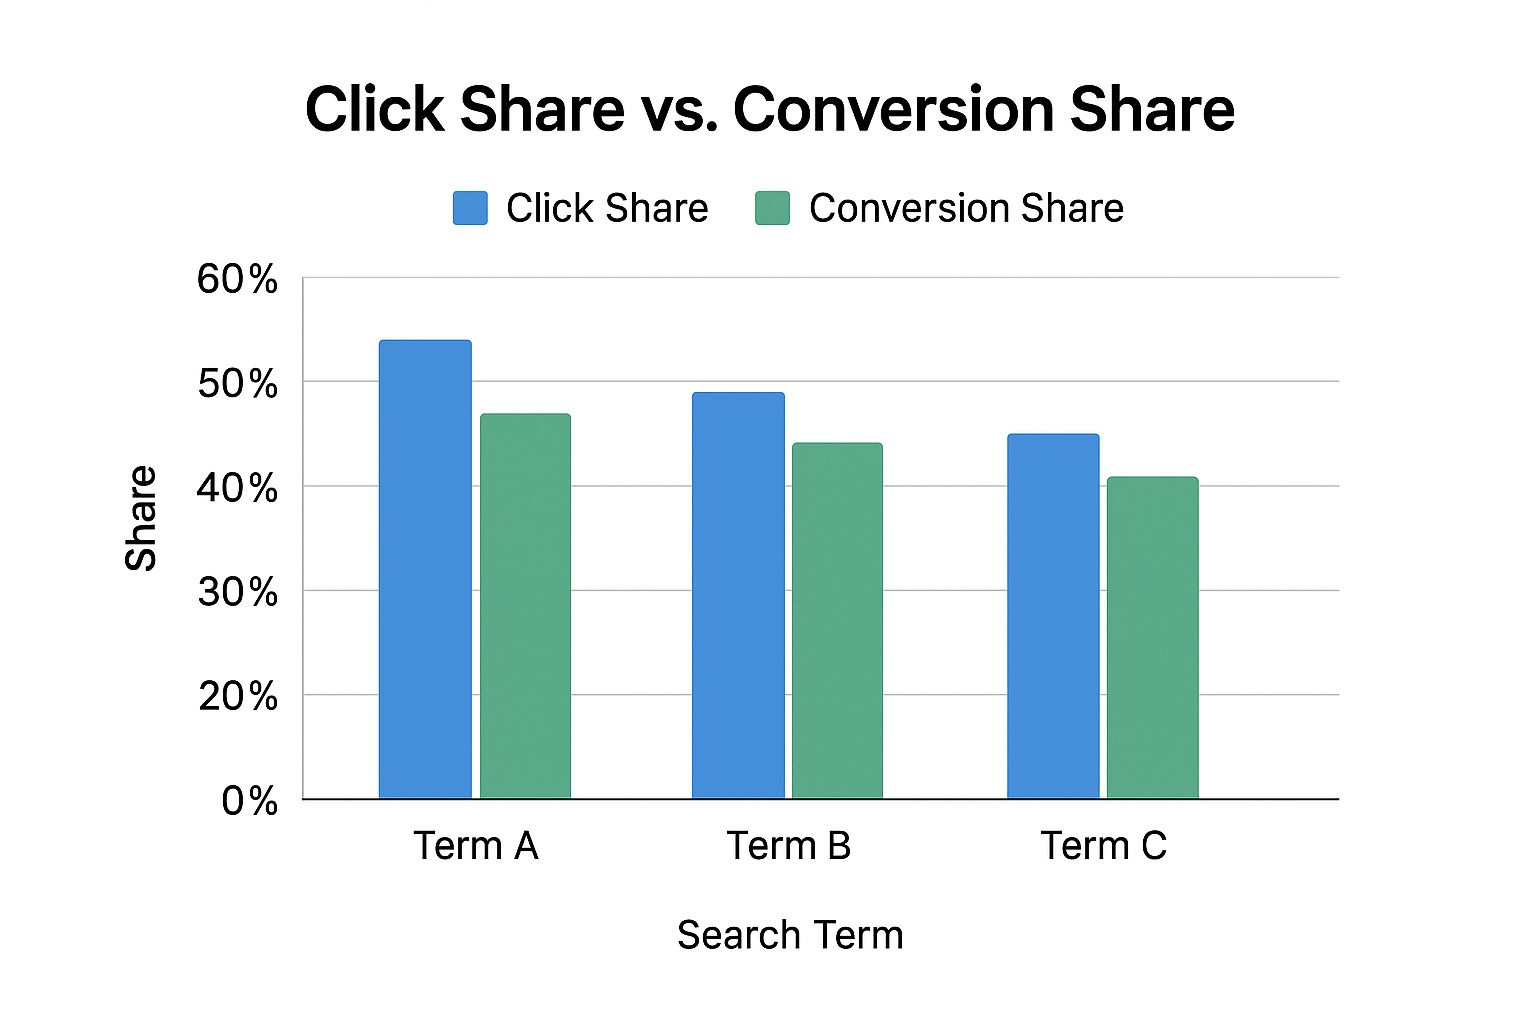
This visualization clearly shows that while "Term A" generates the most clicks, "Term B" has a significantly higher conversion share, making it a more valuable keyword for driving actual revenue. Regularly incorporating these high-converting, relevant search terms directly into your product title, bullet points, and backend keywords is a fundamental practice for improving organic rank and sales velocity on Amazon.
2. Item Comparison and Alternative Purchase Behavior
Understanding your direct and indirect competition is fundamental to positioning your brand for success. The Item Comparison and Alternative Purchase Behavior reports, key features within Amazon Brand Analytics, offer a direct window into your customers' decision-making process. These reports show you exactly which other products customers viewed and ultimately purchased instead of yours. This provides critical competitive intelligence, helping you move beyond perceived competitors to understand who your customers truly consider as alternatives.

For brand-registered sellers, this data is incredibly powerful. The Item Comparison report lists the top five products most frequently viewed on the same day as yours, revealing your immediate digital shelf competitors. The Alternative Purchase Behavior report goes a step further, showing the top five products customers purchased instead of yours after viewing your product. Analyzing these two reports together gives you a comprehensive view of both consideration and conversion competitors, which are often not the same. For example, a kitchen appliance brand might discover customers are cross-shopping their mid-range blender with both budget alternatives and premium, high-performance models, revealing two distinct customer segments with different value drivers.
How to Use the Competitive Intelligence Data
The true value of these reports comes from turning observation into action. By analyzing these competitor and alternative purchase patterns, you can identify clear opportunities to refine your strategy:
- Losing to Lower-Priced Alternatives: If customers consistently view your product but purchase a cheaper option, it signals a price sensitivity issue. You may need to better justify your price point through enhanced A+ Content, highlighting superior materials, features, or warranty. Alternatively, consider running a targeted promotion or creating a "lite" version of your product to compete directly.
- Losing to Higher-Priced Alternatives: When shoppers choose a more expensive competitor, it indicates your listing isn't effectively communicating your product's value or quality. They are willing to pay more for what they perceive as a better solution. Focus on improving your branding, main image, and bullet points to emphasize premium features, social proof, and unique benefits that justify your price.
- Identifying Bundling Opportunities: The Alternative Purchase report may show customers frequently buying a complementary item from another brand after viewing yours. A skincare brand might find customers who view their facial cleanser often purchase a specific brand of moisturizer. This is a direct signal to create a product bundle or a "Frequently Bought Together" promotion, capturing that secondary sale yourself.
- Informing Advertising Strategy: Discovering a new or unexpected competitor in these reports gives you a powerful new target for your Sponsored Display and Sponsored Products advertising campaigns. You can directly target the ASINs of these alternative products, ensuring your brand appears on their detail pages and intercepting customers at the final point of consideration.
3. Market Basket Analysis
Understanding what else is in your customer's shopping cart is a powerful, yet often overlooked, aspect of e-commerce strategy. The Market Basket Analysis report within Amazon Brand Analytics offers precisely this intelligence. It reveals which products are most frequently purchased at the same time as yours, providing a clear roadmap for bundling, cross-selling, and new product development. This report moves your strategy from assumptions to concrete data about customer purchasing habits.
For brand-registered sellers, this report is a goldmine for increasing average order value (AOV). It details the percentage of times another product was purchased alongside your own, ranked by frequency. For example, a coffee brand might discover customers often buy their whole beans with a specific brand of coffee filter, or a fitness equipment seller could find that resistance bands are commonly purchased with their best-selling yoga mats. These insights are crucial for creating a more holistic and profitable product ecosystem.

How to Use the Market Basket Analysis Data
The real value of this report is in transforming its data into actionable growth strategies. By analyzing these purchasing combinations, you can identify clear opportunities to boost sales:
- Create "Frequently Bought Together" Bundles: If the data shows customers consistently buy your flagship product with a complementary item, create a virtual bundle. This not only makes shopping easier for the customer but also increases the likelihood they purchase both items from you, lifting your overall revenue per transaction.
- Optimize Product Targeting in Ads: Use the insights to inform your Sponsored Products ad campaigns. If customers frequently buy your shampoo with a competitor's conditioner, you can run product targeting ads on that conditioner's listing, capturing a sale you might have otherwise lost.
- Inform New Product Development: Seeing a consistent pattern of customers buying an item your brand doesn't offer is a strong signal for market demand. If your kitchen utensil brand sees customers buying your spatulas with a specific type of mixing bowl, it might be time to develop your own line of mixing bowls.
- Enhance A+ Content and Storefronts: Use your A+ Content to create "Shop the Look" or "Complete the Set" modules that feature these complementary products. This guides the customer’s journey and encourages them to add more items to their cart directly from your product detail page.
You can see a deeper dive into how to interpret and apply these insights in the video below, which explains the core concepts of market basket analysis.
Regularly reviewing this report from Amazon Brand Analytics allows you to stay ahead of customer trends and strategically expand your product offerings. It turns simple transaction data into a powerful tool for increasing customer loyalty and lifetime value by giving them more of what they already want to buy together.
4. Demographics and Geographic Insights
Knowing who your customer is-not just what they search for-unlocks a more sophisticated level of marketing and product development. The Demographics report within Amazon Brand Analytics provides a detailed, anonymized portrait of the people who purchase your products. It breaks down your customer base by key attributes like age, household income, education level, gender, and marital status. This powerful feature moves you from assumptions to facts, helping you understand your audience on a personal level.
This data is crucial for refining your brand's voice, messaging, and overall strategy. For instance, a luxury skincare brand might discover that 60% of its customers are high-income urban females aged 35-54. An outdoor gear company could find a surprisingly strong customer base in mountain states like Colorado and Utah, even if their marketing has been focused elsewhere. These insights allow you to tailor every aspect of your business, from advertising creative to future product development, to resonate with your actual buyers.
How to Use the Demographics Data
The true value of this report is its ability to inform specific, strategic actions. By analyzing your customer profile, you can identify clear opportunities to improve your connection with your audience and attract more like-minded shoppers.
- Refine Your Marketing Message: If you discover your primary customers are college-educated parents, your product copy and A+ Content should speak to their priorities, like safety, educational value, and durability. Shift your messaging from generic features to benefits that resonate directly with this segment's lifestyle and values.
- Optimize Ad Targeting: Use the demographic data to build more precise audiences for your Amazon DSP or social media advertising campaigns. If your buyers are concentrated in specific income brackets or age ranges, you can focus your ad spend on those groups, dramatically improving your return on investment and reducing wasted ad spend.
- Guide Influencer and Affiliate Partnerships: When you know your customer's profile, you can find influencers and affiliates whose audiences are a perfect match. Instead of guessing, you can seek out creators who genuinely connect with high-income 35-year-olds or college students, ensuring your brand is promoted to a receptive and relevant audience. This is a core component of building a successful affiliate program.
- Inform Geographic Strategy: The report also reveals where your customers live, down to the state or even city level. If you see a high concentration of sales in a specific region, you can double down on local marketing efforts, adjust shipping strategies to serve that area better, or even consider it a prime location for retail expansion outside of Amazon. This data is essential for both national growth and identifying untapped local markets.
5. Repeat Purchase Behavior Analysis
Acquiring a new customer is valuable, but fostering loyalty that leads to repeat purchases is the key to sustainable growth. The Repeat Purchase Behavior report within Amazon Brand Analytics is designed to measure this crucial aspect of your business. It provides a clear view into how often customers return to buy your products again, revealing repurchase rates and the average time between orders. This insight helps you understand the "stickiness" of your products and moves you from a single-transaction mindset to a long-term customer value strategy.
This report is especially powerful for brands selling consumable products or items with a natural repurchase cycle, like supplements, pet food, or beauty supplies. It breaks down data by ASIN, showing you the number of unique customers versus repeat customers and calculating the repeat purchase rate. For example, a pet food company might discover a 70% customer retention rate after the first purchase, confirming strong product loyalty. Similarly, a beauty brand could identify seasonal spikes in repeat purchases, allowing for better inventory and marketing planning around those peak times.
How to Use the Repeat Purchase Data
Analyzing this report reveals patterns that can directly inform your retention and inventory strategies. By understanding the lifecycle of your customers, you can take specific actions to encourage loyalty and maximize revenue:
- Low Repeat Purchase Rate: If a specific product shows a low rate of repeat customers, it's a red flag. This could indicate a problem with the product itself, a poor customer experience, or simply that it's not a naturally consumable item. Investigate customer reviews and feedback for that ASIN to identify potential issues and focus your retention efforts on improving the product or post-purchase follow-up.
- Identify Optimal Reorder Timing: The report shows the average number of days between purchases. If a supplement brand finds customers repurchase every 45 days on average, this is incredibly actionable data. You can use this timing to set up targeted "Subscribe & Save" promotions or run remarketing campaigns that remind customers to reorder just before they are likely to run out.
- Forecast Inventory for Consumables: For products with high repeat purchase rates, this data is essential for accurate demand forecasting. Knowing that a large percentage of your customer base will repurchase every 30, 60, or 90 days allows you to manage your inventory levels more effectively, preventing stockouts that could otherwise force loyal customers to switch to a competitor.
By focusing on these metrics, you can create data-driven campaigns to boost customer lifetime value. Tracking the impact of these retention efforts is critical, and you can learn more about how to calculate the lift in sales from your campaigns to measure your success. This proactive approach turns one-time buyers into a predictable, recurring revenue stream, a foundational element for any successful brand on Amazon.
6. Brand Performance Dashboard
Gaining a high-level, real-time understanding of your brand's health on Amazon is essential for strategic planning. The Brand Performance Dashboard in Amazon Brand Analytics serves as this central command center. It aggregates crucial brand metrics like sales performance, market share, customer acquisition, and competitive positioning into a single, comprehensive view. This centralized dashboard allows brand managers to quickly assess overall brand health and pinpoint areas that require immediate attention or present new opportunities.
This powerful overview is exclusive to sellers who have completed the Amazon Brand Registry enrollment, highlighting another key advantage of the program. The dashboard moves beyond individual product performance, offering a holistic look at how your entire brand is trending. For instance, an electronics brand can track its market share growth from 12% to 18% over a quarter, while a fashion retailer can monitor seasonal performance trends across different product categories to better prepare for the next year. It consolidates complex data into easily digestible visualizations.
How to Use the Brand Performance Dashboard Data
The true value of this dashboard is its ability to inform high-level business strategy. By regularly analyzing the aggregated data, you can uncover specific trends and make smarter decisions:
- Monitor Overall Sales Trajectory: Are your brand's total sales growing, stagnating, or declining? The dashboard gives you a quick, top-down view, helping you gauge the effectiveness of your marketing campaigns and pricing strategies at a macro level.
- Track Customer Acquisition: Understand how many new customers your brand is attracting. A decline in new-to-brand customers could signal a need to adjust your advertising to reach a wider audience or refresh your product offerings to appeal to new market segments.
- Benchmark Against Competitors: The dashboard provides insights into your brand's performance relative to key competitors. If your market share is slipping while a competitor's is growing, it’s a clear signal to investigate their listings, pricing, and promotional activities to identify the cause.
A home goods brand, for example, might use the dashboard to identify declining performance in a specific geographic region, prompting a deeper dive into regional logistics or localized competition. Regularly scheduling review meetings with key stakeholders to discuss these dashboard insights is a proactive way to guide quarterly business planning and ensure your entire team is aligned with the brand's performance goals on Amazon.
7. Search Catalog Performance
Analyzing how your products perform within Amazon's vast catalog is essential for improving discoverability and capturing customer attention. The Search Catalog Performance tool, a powerful feature within Amazon Brand Analytics, provides a direct look at your products' journey through the search results. It reveals how shoppers find and interact with your ASINs, showing you key performance indicators like impressions, clicks, and sales for specific search terms. This report allows you to move from broad assumptions to precise, ASIN-level optimization.
For brand-registered sellers, this tool offers an unparalleled view into your organic search footprint. It goes beyond simple keyword tracking by connecting each search term directly to your product's performance. You can see your impressions, click-through rate (CTR), add-to-carts, and total purchases for every relevant keyword. This granular data is invaluable for understanding exactly where your products are succeeding or failing in the search results page, giving you a clear roadmap for improvement.
How to Use Search Catalog Performance Data
The true value of this report is in its actionable metrics, which allow you to diagnose and fix issues in your product's search journey. By analyzing the data, you can identify clear opportunities for growth:
- Ranking on Page 2 (Positions 15-30): If you find keywords where your product consistently ranks on the second page, you have a prime opportunity. These products are on the verge of significant visibility. A focused effort on improving conversion rate through A+ Content or a slight increase in ad spend for these specific terms can often provide the necessary push to get you onto the first page, dramatically increasing impressions and clicks.
- High Impressions, Low CTR: Your product is being seen, but shoppers aren't clicking. This classic issue points to your "first impression" elements. Your main image might not stand out, your title could be missing a key benefit, or your price isn't competitive. A sports equipment seller, for example, might see high impressions for "yoga mat for beginners" but a low CTR. By updating their main image to show the mat in use and adding "extra thick for comfort" to the title, they can make their listing more compelling and boost clicks.
- High Clicks, Low Conversions: Shoppers are interested enough to click but something on the detail page is stopping them from buying. This signals a need to optimize your A+ Content, bullet points, or customer reviews. Does your content answer common questions? Do you have enough social proof? A kitchen appliance brand noticing this pattern for their 'food processor' could add a video to their A+ Content demonstrating its key features, helping to build trust and drive conversions.
By regularly monitoring these metrics, you can systematically improve your organic standing and sales. For a deeper understanding of how these on-page factors contribute to your overall success, you can learn more about how to track Amazon sales. This will help you connect your catalog performance directly to your revenue goals.
Amazon Brand Analytics: 7-Item Feature Comparison
| Item Title | Implementation Complexity 🔄 | Resource Requirements ⚡ | Expected Outcomes 📊 | Ideal Use Cases 💡 | Key Advantages ⭐ |
|---|---|---|---|---|---|
| Search Terms Report | Moderate - requires Brand Registry and data interpretation | Medium - weekly data updates, analysis time | Understand search behavior and optimize listings and PPC | Keyword optimization, PPC campaign targeting | Reveals actual customer search behavior and competitive insights |
| Item Comparison and Alternative Purchase Behavior | Moderate - needs sufficient product traffic volume | Medium - requires traffic volume and analysis | Identify competitors and customer cross-shopping patterns | Competitive intelligence, product positioning, pricing | Identifies direct/indirect competitors, guides product bundling and advertising |
| Market Basket Analysis | Moderate to High - needs transaction volume and correlation analysis | Medium to High - substantial transaction data and analysis | Discover complementary products for bundling and cross-selling | Cross-selling, bundling, inventory planning | Informs bundling strategies and customer lifestyle understanding |
| Demographics and Geographic Insights | Low to Moderate - uses aggregated anonymized data | Low - aggregated demographic data | Targeted marketing, geographic expansion decisions | Marketing personalization, geo-targeting | Enables tailored marketing and product positioning |
| Repeat Purchase Behavior Analysis | Moderate - requires long-term purchase data tracking | Medium - long-term data and analytics | Predict demand, improve retention, optimize inventory | Consumable and subscription products | Identifies loyal customers, optimizes repeat purchase timing |
| Brand Performance Dashboard | Moderate - integrates multiple data sources | Medium to High - ongoing monitoring and dashboard upkeep | Holistic brand overview, trend detection | Executive reporting, brand health monitoring | Provides consolidated brand metrics and competitive benchmarking |
| Search Catalog Performance | Moderate to High - continuous SEO and ranking monitoring | Medium - ongoing optimization efforts | Improved product discoverability and sales | SEO optimization, product listing improvements | Identifies keyword opportunities and tracks search performance |
From Insights to Action: Integrating Analytics with Your Growth Strategy
Navigating the world of Amazon selling without data is like sailing a ship without a compass. Throughout this guide, we have journeyed through the seven core reports of Amazon Brand Analytics, demystifying each one to transform you from a passive observer into an active, data-driven strategist. We’ve seen how these tools provide a direct line into the minds of your customers, revealing not just what they buy, but how they search, compare, and ultimately decide.
The real power of Amazon Brand Analytics isn’t found in any single report, but in the connections you make between them. The journey from raw data to tangible profit is paved with deliberate, informed actions. Mastering these reports means you are no longer guessing; you are calculating. You are building a business on a foundation of evidence, not assumptions.
Key Takeaways: Your Blueprint for Growth
Let's distill our deep dive into a few core, actionable principles. These are the takeaways that should become second nature as you integrate Amazon Brand Analytics into your daily operations.
- Keywords Are Your Currency: The Search Terms Report and the Search Catalog Performance report are your treasure maps. They show you exactly which keywords are driving impressions, clicks, and most importantly, conversions. These aren't just terms to stuff into your listing; they are the language of your customer. Use them to optimize your titles, bullet points, backend keywords, and A+ Content to align perfectly with shopper intent.
- Know Thy Enemy (and Their Customers): The Item Comparison and Alternative Purchase Behavior reports offer a priceless look into your competitors' strengths. When you see customers viewing your product but buying another, that is a direct, actionable signal. Is it price? Is it a key feature mentioned in their listing you’ve overlooked? This insight is your chance to adapt, innovate, and win back that sale.
- The Customer Journey is a Story: Market Basket Analysis tells you what your customers buy together, while Demographics and Repeat Purchase Behavior reports reveal who they are and how often they return. Piecing this story together allows you to create more effective bundles, targeted promotions, and marketing campaigns that resonate on a personal level, fostering loyalty and increasing lifetime value.
Turning Data into a Dynamic Growth Engine
Understanding these reports is the first crucial step. The second, and more impactful step, is turning this knowledge into a continuous, strategic feedback loop. The insights from Amazon Brand Analytics should not remain isolated within your Seller Central account. They must flow into every corner of your business strategy, especially your external marketing and affiliate partnerships.
Consider the Search Query Performance data, which gives you a granular view of impressions, clicks, add-to-carts, and conversion rates for specific keywords. Imagine identifying a set of long-tail keywords with high conversion rates but low search volume. This is your untapped goldmine. The next step is to activate this intelligence.
This is where the synergy with a platform like Coral becomes transformative. Instead of simply sending affiliates a product link, you can now equip them with a data-backed creative brief:
- Provide a list of high-converting, low-competition keywords for them to target in their YouTube video titles, blog post headings, and social media captions.
- Share demographic profiles of your most loyal customers so they can tailor their content’s tone and style to the right audience.
- Show them which products are frequently bundled so they can create content around complementary use cases, driving larger cart sizes.
By doing this, you elevate your affiliate program from a transactional sales channel to a sophisticated, insight-driven marketing engine. Your creators and partners become an extension of your data team, armed with the precise information needed to create content that doesn't just attract clicks, but genuinely converts. This connection between internal analytics and external execution is what separates stagnant brands from those that achieve scalable, sustainable growth on Amazon.
Ready to bridge the gap between your Amazon Brand Analytics data and your affiliate marketing strategy? Coral provides the platform to manage, track, and empower your creators with the insights they need to drive real results. Transform your data into a powerful growth engine by visiting Coral and discovering how to build a smarter affiliate program today.