Calculate Lift in Sales: Proven Strategies for Amazon Sellers
Category: Calculate lift in sales
Why Most Sales Lift Calculations Are Wrong (And What Actually Works)

Let's be honest, most sales lift calculations are, well, wrong. Many teams take a simplistic "before and after" approach. They check sales before a campaign, check sales after, and declare the difference "lift." From talking to other marketers, I know this oversimplifies things.
There are so many things that can affect sales, completely unrelated to your campaign.
Think about it: imagine launching a new line of sunglasses right as summer kicks off. Sales are going to go up, sure. But is that really down to your marketing genius, or just the fact that everyone wants shades when the sun's blazing?
This is the trap. Standard lift calculations often miss the bigger picture.
They don't account for all the real-world stuff happening in the background, like competitor activity, changes in the economy, or even just normal sales fluctuations. The US retail sector is a prime example. It’s seen average year-on-year growth of 4.77% from 1993 to 2025. This underlying growth isn’t from any single campaign, it’s just the market doing its thing. Explore retail sales trends for more context.
How do we filter the background noise to see the true impact of your marketing?
Isolating True Campaign Impact
The trick is a robust baseline. This isn’t just last month's or last quarter's sales figures. A good baseline takes into account historical trends, seasonality, and anything else relevant to your business.
If you’re selling on Amazon and using Coral, for example, you can compare your data to the same period last year using the Amazon Attribution integration. This helps account for those seasonal ups and downs.
The length of your measurement window matters too. Too short, and you might miss the longer-term effects. Too long, and you risk other factors clouding the results.
The bottom line? Accurately calculating sales lift requires more nuance. It means being honest about what else might be influencing sales and building a data-driven baseline that reflects your specific business reality. This gives you a much clearer understanding of what your campaigns are actually achieving, so you can go beyond vanity metrics and use those insights to shape your future strategy.
Building Your Data Foundation (The Smart Way)
Let's talk sales lift. What data do you really need to make this calculation work for you? Forget drowning in spreadsheets. I’ve been there, and I can tell you, keeping it simple is key. Focus on the essentials.
First up: your baseline.
This is your pre-campaign sales data, but with a crucial twist. Seasonality matters. If you sell more swimsuits in summer, don't compare a summer campaign to spring sales. Compare it to last summer's sales. Think apples to apples.
Now, let’s look at your campaign period sales.
This is where you track sales during your campaign. Coral’s Amazon Attribution integration makes this super easy, tracking every sale from your affiliate links. Visualizing this is powerful. Check out how the infographic below compares baseline sales with campaign sales and highlights the lift:
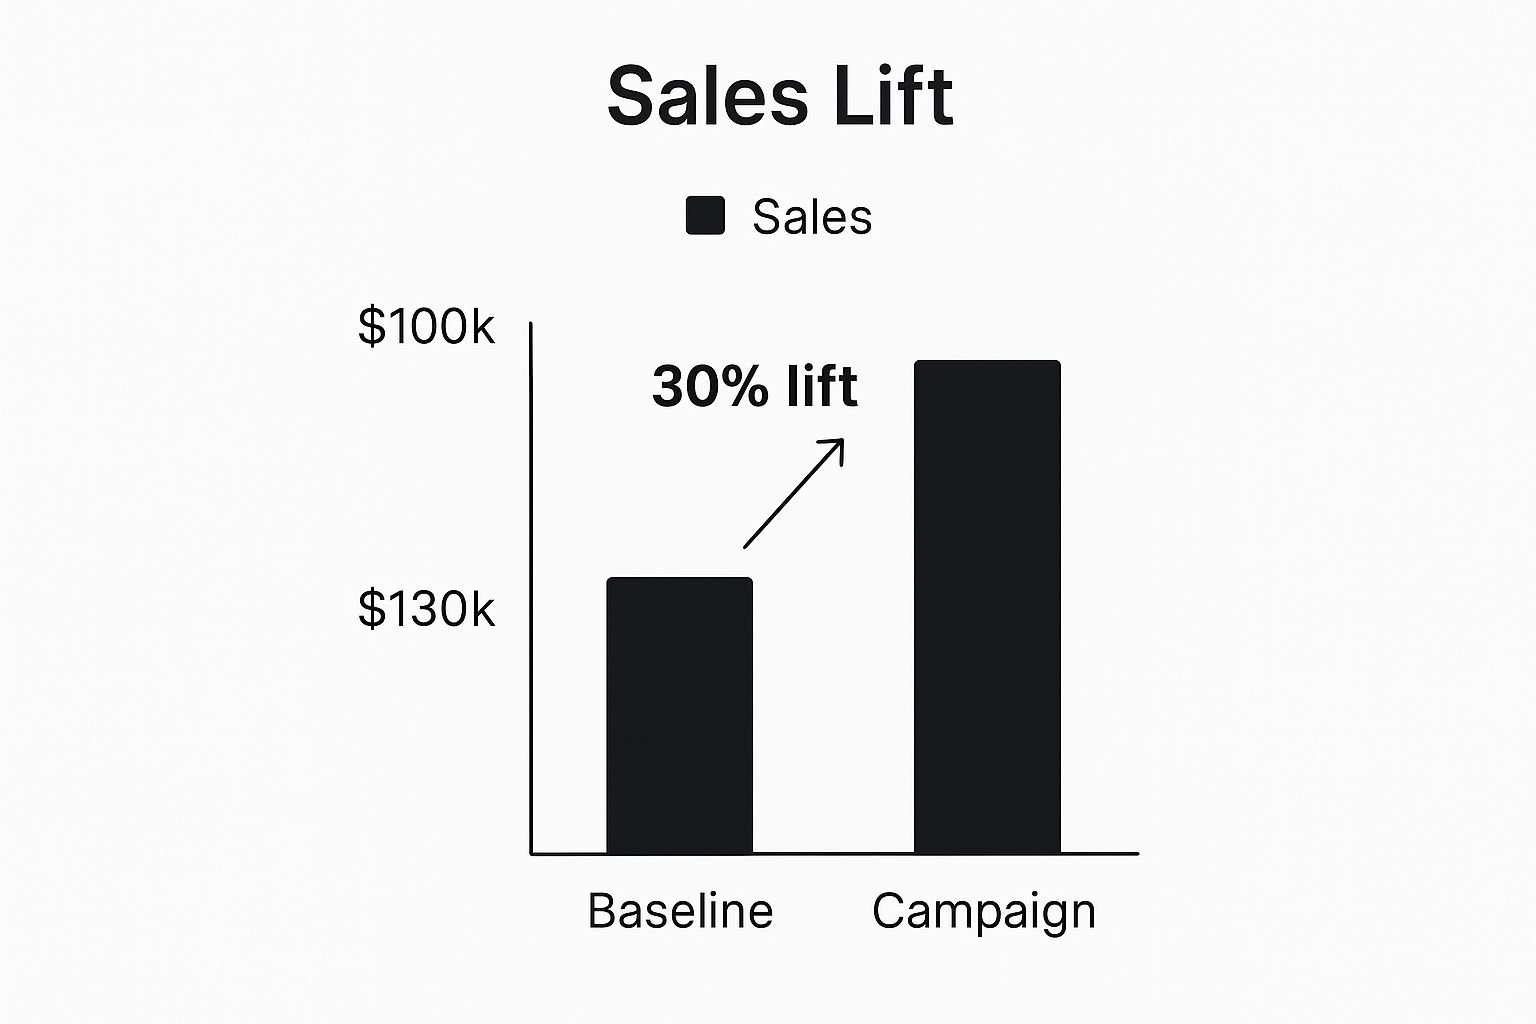
See? The campaign generated a 30% lift in sales compared to the baseline. This visual really helps you understand the impact and communicate the results clearly.
Finally, consider those pesky external factors.
Did a competitor run a massive sale during your campaign? Did unexpected weather impact demand? These things can skew your sales lift calculations. Noting them down helps you interpret your results accurately. It's not always about quantifying these factors, but acknowledging their influence. This gives you a more complete picture of your results.
To help organize your data gathering, take a look at the table below summarizing the essential data points for sales lift calculation:
Essential Data Points for Sales Lift Calculation
A comprehensive comparison of required vs. optional data points with their impact on calculation accuracy
Data Point | Priority Level | Impact on Accuracy | Collection Method |
|---|---|---|---|
Baseline Sales | Required | High - establishes the foundation for comparison | Historical sales data |
Campaign Period Sales | Required | High - directly reflects the campaign's impact | Amazon Attribution, sales platform |
Seasonality Adjustments | Required | High - ensures accurate comparison by accounting for cyclical trends | Historical sales data |
Competitor Activity | Optional | Medium - provides context and insights into external influences | Market research, competitor analysis |
External Events (e.g., weather) | Optional | Medium - helps explain unexpected fluctuations | News sources, weather data |
This table highlights the critical data points (baseline and campaign sales, along with seasonality adjustments) that are fundamental to your calculations. While competitor activity and external events are optional, incorporating them provides valuable context and can greatly improve the accuracy of your analysis. Remember, a solid data foundation is everything!
The Sales Lift Formula That Makes Business Sense

Forget complex equations. Let's break down sales lift calculations in a practical, easy-to-understand way. The basic idea is comparing what actually happened during your campaign with what would have happened if you hadn't run it. This "what if" scenario is your baseline.
We've already talked about how important a solid baseline is. Now let's see it in action. The most straightforward formula is:
Lift = (Campaign Sales - Baseline Sales).
This gives you the absolute lift, which is the direct increase in sales. For example, if your campaign generated 100 sales and your baseline was 80, your absolute lift is 20.
Often, percentage lift is even more helpful. This shows the lift as a percentage of your baseline:
Percentage Lift = ((Campaign Sales - Baseline Sales) / Baseline Sales) * 100
Using the same example, the percentage lift would be (20 / 80) * 100 = 25%. This makes comparing different campaigns much easier, even if their baseline sales are drastically different.
By the way, the impact of sales lift is huge in global e-commerce. In 2024, e-commerce sales reached approximately $6 trillion, and they're projected to grow by 31% to nearly $8 trillion by 2028. This growth is fueled by increasing digital adoption, particularly in Asia. Want to learn more? Dive deeper into these e-commerce trends.
This simple formula is a great starting point. But, there's always more to the story. Different campaign types, customer segments, and business models call for tweaks to the formula. We'll explore these nuances next, showing you how to refine this basic formula to get truly valuable insights. It's all about going beyond the numbers and understanding what they really mean for your bottom line.
Making Sense of Your Results (Beyond the Numbers)
So, you’ve calculated your sales lift percentage. Awesome! That’s a solid first step. But honestly, it’s just a number sitting there. The real value comes from understanding what that number actually means for your business. A 10% lift could be phenomenal for one product and totally disappointing for another. Context is everything.
Experienced marketers get this. They dig deeper than the basic calculation and factor in things like customer lifetime value and profit margins. Think about it: a small lift on a high-margin product could actually be more profitable than a big lift on a low-margin product. This is where a deep understanding of your business model is crucial. Don't forget the long-term brand impact, either. Sometimes a campaign that doesn’t deliver a huge immediate lift can still build valuable brand awareness that pays off later.
Recognizing Red Flags and Confidence Intervals
Here's the thing: not all data is created equal. Sometimes, your lift calculations might be a bit off because of measurement errors. It’s important to learn how to spot those red flags. Did you consider seasonality? Were there any outside factors that could have skewed the data? If something seems weird, dig in and figure out why.
You Might Be Interested In: How to track Amazon Sales
Then there are confidence intervals. These tell you how much you can trust your results. Basically, a 95% confidence interval means you’re 95% sure the actual lift falls within a specific range. Let's say your calculated lift is 15% with a confidence interval of 10-20%. That means you're pretty sure the real lift is somewhere between 10% and 20%. This is super important for making smart decisions.
Turning Data into Action
Ultimately, you want to turn your lift data into actionable insights. What does a 5% lift really mean for your marketing strategy? Should you invest more in that tactic, or try something new? Don't just stare at the numbers. Focus on what they tell you about your customers and your business.
Sometimes, lift results are just interesting data points. Other times, they're a call to action. Knowing the difference is a key skill for successful marketers.
To help you interpret your sales lift data and decide on the best course of action, I've put together a handy guide:
Sales Lift Interpretation Guide: How to interpret different lift percentages and what actions to take based on your results.
Lift Percentage Range | Interpretation | Confidence Level | Recommended Action |
|---|---|---|---|
0-5% | Minimal Impact | Low | Investigate potential issues, refine campaign targeting, or test alternative strategies. Consider external factors. |
5-10% | Moderate Impact | Medium | Analyze contributing factors, optimize campaign performance, and potentially increase investment. |
10-20% | Significant Impact | High | Scale successful strategies, allocate more budget, and monitor for sustained performance. |
20%+ | Exceptional Impact | Very High | Analyze what's working exceptionally well, document the strategy, and look for opportunities to replicate success across other campaigns. |
This table provides a general framework. Remember to consider your specific business context, goals, and industry benchmarks when interpreting your results. A 5% lift might be amazing in a highly competitive market, while a 20% lift might be underwhelming in a niche market. The key takeaway is to use your data to make informed decisions that drive business growth.
Where Things Go Wrong (And How to Avoid the Traps)

Let’s be honest, figuring out sales lift can be a headache. Even with experience, it’s surprisingly easy to stumble into common traps. One big one? Cherry-picking data. We've all been tempted to highlight the times our campaign performed well while quietly ignoring the less stellar periods. This creates a rosy picture that's just not realistic. Believe me, I've learned this the hard way.
Another mistake is forgetting about what's happening in the wider world. Imagine analyzing a winter clothing campaign when a blizzard suddenly hits. Sales go through the roof. Success, right? Well, maybe. Did your amazing ads drive those sales, or did everyone just realize they desperately needed a new parka? To get a truly accurate view, you have to factor in those external forces.
Sometimes, calculating sales lift means looking beyond your own campaign. Take the global elevator and escalator market, for example. It hit $85.2 billion in 2023 and is expected to keep growing through 2028. That's not just down to marketing – think urbanization and infrastructure development, particularly in the Asia-Pacific region. Discover more insights on this market.
Avoiding Common Pitfalls
So, how do you avoid these pitfalls? First, set a clear baseline before your campaign even begins. This helps prevent cherry-picking later on. Second, think carefully about your measurement window. Don’t jump the gun and measure too soon – give your campaign time to breathe and make an impact.
Finally, if you’re using Amazon Attribution links with Coral, double-check that you’ve set everything up correctly before launch and do not modify the Amazon Attribution campaigns and ad groups on Amazon after launch.
Check out our guide on Amazon Attribution links for more information. A good setup is essential for getting reliable data.
Incomplete data is another challenge. Not every campaign yields perfect data, but don’t let that stop you. There are smart ways to handle missing data points without sacrificing accuracy. Statistical methods like imputation can help fill in the gaps responsibly, giving you a more solid foundation for your lift calculations.
Small sample sizes can also make it tough to draw meaningful conclusions. With limited data, proving statistical significance is tricky. Your observed lift might be due to random chance rather than your campaign's effectiveness. Honesty about these limitations is important.
Acknowledging how sample size affects your calculations keeps you grounded. By understanding these potential pitfalls, you can calculate sales lift accurately and make more informed marketing decisions. It's not about aiming for perfection, it's about getting a clear, realistic understanding of your campaign’s performance.
Advanced Approaches for Complex Campaign Scenarios
Ready to take your sales lift calculations to the next level? Basic formulas are fine for simple campaigns, but things get more interesting when you're dealing with multiple touchpoints, longer sales cycles, or campaigns spread across various platforms. Let me share some insights from my own experience.
Let's say you're running a campaign that combines email marketing, social media ads, and influencer partnerships. Untangling which channel is actually driving sales can feel like detective work. This is where incremental lift analysis shines. By isolating each channel's impact, you can see what's working and what needs adjustment. I’ve personally found this incredibly helpful for complex product launches where different channels play specific roles throughout the customer journey.
Another challenging scenario is when A/B testing just isn't feasible. Think about long B2B sales cycles or high-value, low-volume conversions. In these cases, synthetic control methods can be a game-changer. This involves creating a "synthetic" control group using historical data and market trends, allowing you to estimate lift even without a traditional control group. It's a bit more involved, but it can offer valuable data when other methods come up short.
For example, imagine selling enterprise software with a six-month sales cycle. A traditional control group for that timeframe is rarely practical. A synthetic control group, however, lets you estimate the campaign's impact by comparing your actual results to what would have happened based on past trends. It’s not a perfect solution, but it's a powerful tool in specific situations.
Handling Multi-Platform Challenges
Measuring lift across multiple platforms with audience overlap adds another layer of complexity. How do you account for how different channels interact? One approach is using multi-touch attribution models. These models assign credit to each touchpoint based on its contribution to the final conversion. For a deeper dive, check out our article about affiliate management software. These models can be complex, so choose one that aligns with your business goals and your data capabilities.
Finally, remember that advanced techniques aren’t always necessary. Sometimes a simpler approach is perfectly adequate. It’s all about understanding the trade-offs between complexity and accuracy. If you're running a straightforward promotion, a basic lift calculation might be all you need. But for complex campaigns with many touchpoints and overlapping audiences, these advanced approaches can unlock invaluable insights.
Ready to streamline your affiliate marketing and see the true potential of your Amazon sales? Explore Coral today and discover how our platform empowers you to manage, track, and optimize your affiliate program effortlessly.