Unlocking Sales with Brand Analytics Amazon
Category: Brand analytics amazon
Amazon Brand Analytics is an incredibly powerful set of tools that Amazon gives to sellers enrolled in its Brand Registry program. Think of it as a direct line into your customers' minds, showing you what they search for, how they buy, and even how you stack up against the competition. It turns a mountain of raw data into real, actionable strategies you can use to grow.
What Is Brand Analytics and Why It Matters
Imagine you could stand behind a one-way mirror, watching exactly how millions of shoppers find, consider, and buy products on Amazon. That's pretty much what Brand Analytics gives you. It’s not just another reporting dashboard; it's a competitive intelligence powerhouse that peels back the curtain on the world's biggest online marketplace.
Instead of guessing or relying on shaky third-party data, Brand Analytics hands you first-party information straight from the source. It helps you answer the questions that can make or break your success. What keywords are people actually typing into the search bar? What other products do they add to their cart along with yours? Who is your typical customer?
From Raw Data to a Competitive Edge
Getting a handle on this information is the difference between just having a product on Amazon and truly building a brand. The insights you find here can fuel smarter decisions across your entire operation.
- Optimize Your Listings: You can uncover high-value keywords you’ve been missing and weave them into your product titles, bullet points, and descriptions to climb the search rankings.
- Sharpen Your Ad Campaigns: Find out which search terms actually lead to sales and put your ad budget where it counts, cutting down on wasted clicks and improving your ACoS (Advertising Cost of Sale).
- Develop Your Next Bestseller: By analyzing what shoppers are searching for, you can spot gaps in the market and guide your new product ideas with real customer demand.
- Create Smart Product Bundles: The Market Basket Analysis report shows you what products are frequently bought together, giving you the perfect recipe for creating bundles that boost your average order value.
This tool is a huge perk of being in the Brand Registry program and a major reason why getting registered is a must for any serious seller. To see what else you get, you can read our guide on the https://coral.ax/blog/amazon-brand-registry-benefits. Access to this data shifts you from just reacting to sales to proactively building a strategy.
Think of it this way: Selling on Amazon without Brand Analytics is like driving in a new city with a paper map. Once you have it, it's like having a live GPS showing you traffic, shortcuts, and the fastest way to get where you want to go.
A Quick Look at the Insights
To give you a clearer picture, here’s a quick rundown of the kinds of intel you can pull from Brand Analytics and how it can directly impact your business.
| Insight Category | What It Tells You | How It Helps Your Business |
|---|---|---|
| Search Term Data | The exact keywords customers use to find products like yours, ranked by popularity. | Optimize your listings and PPC campaigns with proven, high-intent keywords. |
| Click & Conversion Share | Which products (including competitors') get the most clicks and conversions for a specific keyword. | See exactly who you're competing against for top search terms and identify opportunities. |
| Demographics | The age, income, education, and gender of your customers. | Create more targeted marketing and develop products that resonate with your core audience. |
| Repeat Purchase Behavior | How many customers come back to buy from you again. | Measure brand loyalty and the effectiveness of your customer retention efforts. |
| Market Basket Analysis | What other products are most frequently bought at the same time as yours. | Uncover cross-selling opportunities and create strategic product bundles. |
As you can see, this isn't just about numbers; it's about understanding the "who, what, and why" behind every sale.
The Power of Business Intelligence
To really grasp what Amazon is offering here, it helps to understand what business intelligence analytics is. At its heart, it’s all about using data to make better, more informed decisions. Amazon is sitting on one of the richest data sources in the world, and Brand Analytics is your key to unlocking it.
With reports like Search Catalog Performance and Repeat Purchase Behavior, you get aggregated data that helps you fine-tune everything from your listings to your ad strategy. Brands that dig into this data have seen major performance boosts, with some reporting sales increases of 20% or more year-over-year. When you know the exact search terms people use and your share of the conversions, you can dial in your marketing with incredible precision.
How Do You Get Access to Amazon Brand Analytics?
Getting your hands on the powerful data inside Brand Analytics isn't automatic. It’s a special perk, and the key to unlocking it is the Amazon Brand Registry. Think of Brand Registry as your VIP pass—without it, the door to Brand Analytics stays closed.
The absolute must-have for getting in is an active, registered trademark for your brand's name or logo. There's no way around this. It’s how Amazon confirms you're the real owner of the brand, which is crucial for protecting you (and your customers) from counterfeiters and intellectual property theft.
Getting Your Ducks in a Row First
Before you even think about starting the application, do yourself a favor and get all your documents ready. The biggest reason for delays is having to hunt for information midway through the process.
Here’s what you’ll need to have on hand:
- Your Brand Name: It must have an active registered trademark (either text-based or image-based).
- Trademark Registration Number: This is the official number from the government trademark office, like the USPTO in the U.S.
- A List of Product Categories: You'll need to tell Amazon which categories your products fall into.
- Product and Packaging Photos: Get clear pictures that show your brand name or logo permanently fixed to your products and their packaging.
You can kick off the whole process right from the official Amazon Brand Services page.
As you can see, the page points you straight to either enrolling in Brand Registry or setting up your store, laying out the big benefits like brand protection and growth tools.
The Enrollment and Verification Steps
Once you have your info gathered, head over to the Amazon Brand Registry site to apply. You'll create a Brand Registry account, enter your brand's details, and submit your trademark information.
After you hit submit, Amazon kicks off a verification process. This is the important part: they will reach out to the official contact person listed on your trademark filing to confirm you’re authorized to enroll the brand. It’s a security check to make sure the right person is in control.
Pro Tip: That verification email from Amazon is time-sensitive. Give your trademark attorney or the official contact a heads-up to be on the lookout for it. A quick response is key to avoiding major delays.
Honestly, a missed verification email is one of the most common roadblocks we see. Once they respond and you get the green light, your brand is officially approved. You'll then get access to all the brand protection tools and the full suite of Amazon Brand Analytics reports right inside Seller Central. This is the moment you go from just being a seller to being a truly data-driven brand owner.
Getting to Grips with the Core Analytics Reports
Once you're in Brand Registry, you unlock the real command center for your brand on Amazon. This isn't just about more data; it's about getting the right data. The reports inside Brand Analytics tell a story—about your customers, your competition, and where your brand fits into the bigger picture. Learning to read these stories is what separates the sellers who guess from the ones who grow.
Think of it this way: your standard Seller Central business reports are like your car's dashboard. They show your speed (sales) and how much gas is in the tank (inventory). Brand Analytics is the Waze or Google Maps for your business—it shows you competitor routes, traffic jams, and popular destinations you never even knew existed.
This image really highlights the difference between the surface-level metrics most sellers watch and the deeper insights you get from Brand Analytics.
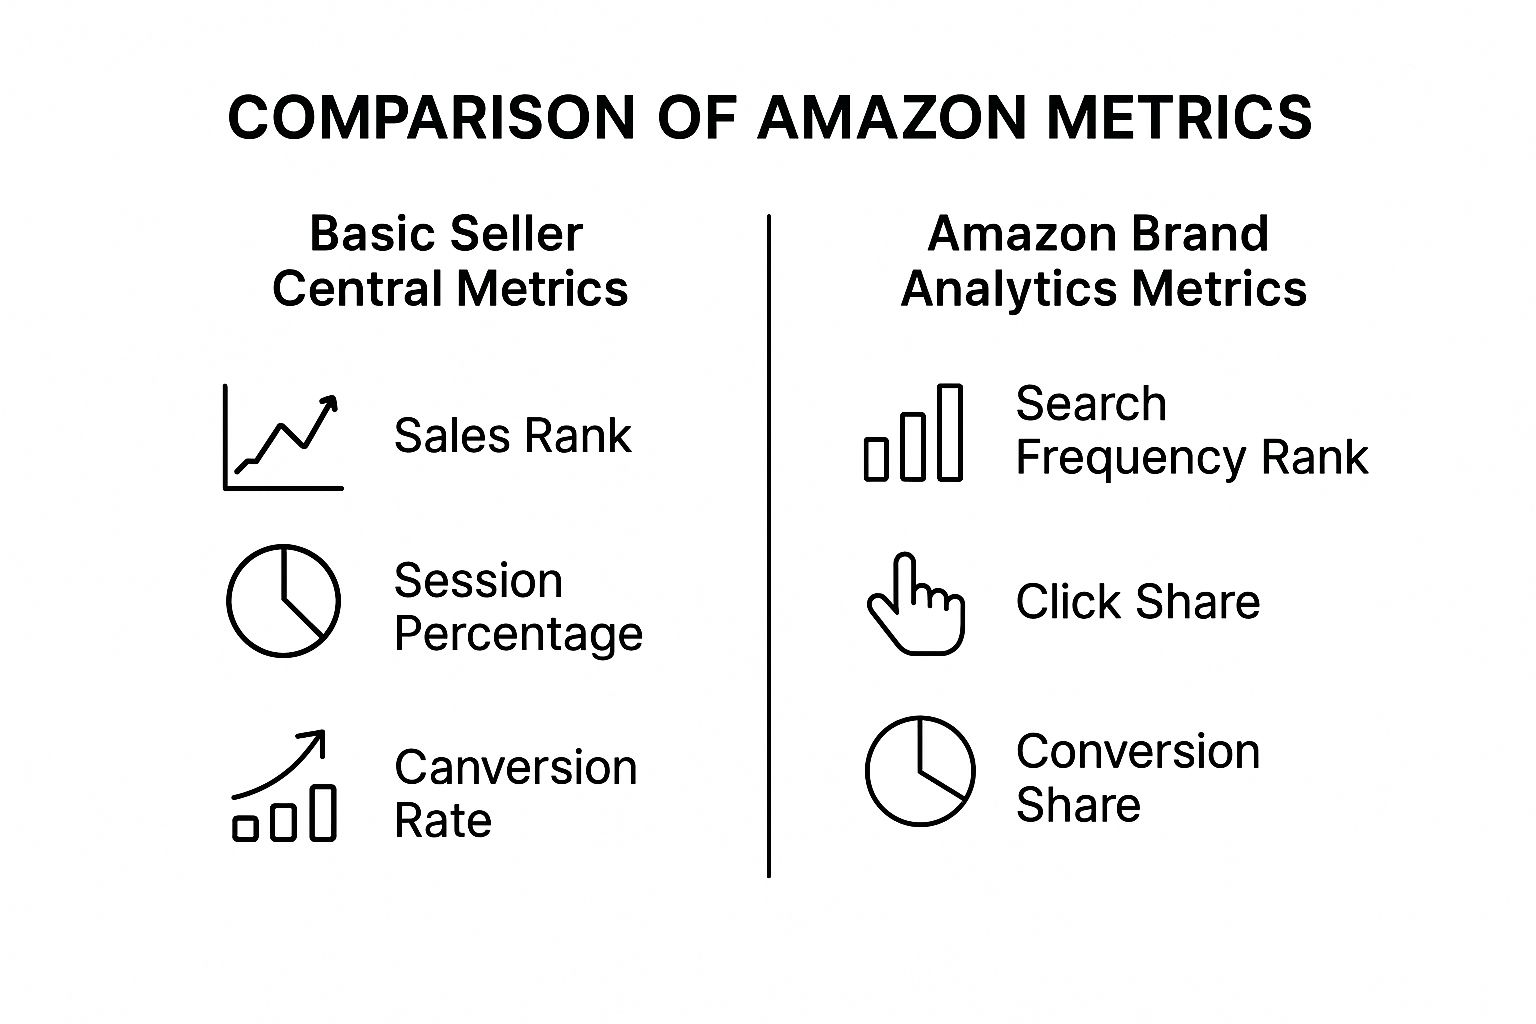
As you can see, it's a huge shift. You go from looking at your own performance in a silo to truly understanding how you stack up against everyone else on Amazon. Let’s dive into the most powerful reports you'll be using.
To give you a quick overview, here's how the main reports stack up against each other.
Core Brand Analytics Reports at a Glance
| Report Name | Primary Function | Key Use Case Example |
|---|---|---|
| Search Query Performance | Reveals how customers find your products via search and how you perform against competitors for those keywords. | Discovering you get many clicks but few sales for "espresso machine," indicating a problem on your product page. |
| Market Basket Analysis | Shows the top 3 products customers buy at the same time as yours. | Finding out buyers often purchase a specific brand of coffee beans with your machine, creating a bundling opportunity. |
| Repeat Purchase Behavior | Tracks how many orders come from new vs. repeat customers over time. | Seeing if a new packaging design or a recent marketing campaign boosted customer loyalty and repeat buys. |
| Customer Demographics | Breaks down your customer base by age, income, gender, and more. | Tailoring your A+ Content to resonate with your main audience, like affluent women aged 35-44. |
Each of these reports offers a unique window into your business, helping you build a complete picture of your performance. Let's look at them a bit closer.
Search Query Performance
If you only have time to master one tool in Brand Analytics, make it this one. The Search Query Performance report shows you the exact terms shoppers are typing into the search bar that lead them to see, click on, and buy your products. Even better, it shows you how your brand's performance for those keywords compares to the entire marketplace.
Here's the key data it gives you:
- Impressions: How many times your brand's products showed up in search results for a specific term.
- Clicks: How many people actually clicked on your products for that term.
- Click Share: Your slice of the pie. This is your brand's percentage of total clicks for a keyword, showing how well you grab attention.
- Conversions: The number of sales your brand made after a customer searched that term.
- Conversion Share: Your brand's percentage of total sales for that keyword. This tells you if you're actually closing the deal or just getting window shoppers.
Let's say you sell premium coffee makers. This report might show that you have a high click share for "espresso machine," but your conversion share is lagging. That’s a huge insight! It means your main image and title are doing their job, but something on your detail page—maybe the price, reviews, or bullet points—is making shoppers bail and buy from a competitor instead.
Market Basket Analysis
Ever wonder what else is in your customer's shopping cart when they buy your product? The Market Basket Analysis report pulls back the curtain, revealing the top three products most frequently bought at the same time as yours.
This is pure gold for finding smart cross-selling and bundling opportunities.
Imagine you find that 70% of customers who buy your coffee maker also purchase a specific brand of espresso beans. That's not a coincidence; it's a business opportunity. You could create a "Coffee Lover's Starter Kit" bundle, run targeted ads on that bean listing, or even launch your own private-label beans.
This report helps you see your product not just as a single purchase, but as part of a customer's larger shopping mission.
Repeat Purchase Behavior
It's always cheaper to keep a customer than to find a new one. The Repeat Purchase Behavior report gives you a clear look at your customer loyalty, showing you precisely how many orders for any ASIN (or your whole brand) come from new vs. repeat buyers.
This data is vital for gauging the long-term health of your brand. A high repeat purchase rate is a great sign—it points to strong brand loyalty, good product quality, and a great customer experience. If that number is low or dropping, it might be an early warning of a problem you need to fix. To get a more detailed look at the metrics, our complete guide on https://coral.ax/blog/amazon-brand-analytics offers additional context.
You can also use this report to see if things like a recent packaging change or a new marketing campaign actually moved the needle on customer retention.
Customer Demographics
Who is your ideal customer, really? Instead of guessing, the Demographics report gives you hard data, breaking down your buyers by:
- Age
- Household Income
- Education Level
- Gender
- Marital Status
This is incredibly useful for sharpening your brand voice, ad targeting, and even your product development pipeline. If the data shows your main buyers for a kitchen gadget are affluent, educated women aged 35-44, you can write your A+ Content and design your ad creative to speak directly to them. For those who need to pull this data into a centralized dashboard, advanced reporting solutions like Supermetrics can help connect your Amazon data with other marketing channels for a fuller customer view.
By getting comfortable with these core reports, you can turn Brand Analytics from a complicated dashboard into your most trusted business advisor. Each report gives you a different angle on your performance, providing the 360-degree view you need to outsmart the competition.
Turning Data Into Profitable Actions
Looking at all these reports is one thing, but the real magic happens when you turn those numbers into actual business growth. Raw data is a bit like a pile of uncooked ingredients—full of potential, but it's not a meal until you mix it with a solid strategy. This is where we’ll connect the dots between the analytics and your bottom line.
Think of the next few sections as mini-playbooks. Each one is designed to show you how to use a specific report to make real, measurable improvements to your sales, marketing, and customer loyalty.
Uncovering Keyword Gold with Search Query Performance
The Search Query Performance report is your treasure map to high-converting keywords. It tells you exactly what shoppers are typing into the search bar, but its true power lies in showing you where the performance gaps are—for both you and your competitors.
Let's use this report to build a smarter keyword strategy for your listings and PPC campaigns.
- Find High-Conversion, Low-Share Keywords: Look for search terms where you have a high Conversion Share but a low Click Share. This is a huge signal. It means that when shoppers do find you for that keyword, they buy. The problem is, not enough of them are finding you in the first place.
- Take Action: These keywords need to become your top priority. Move them to the front of your PPC campaigns, bump up your bids, and make sure they’re featured prominently in your product title and bullet points. The goal is to close that gap and capture more of that ready-to-buy traffic.
- Spot "Striking Distance" Keywords: Scan the report for keywords where your brand is ranked #4 or #5 in clicks. Everyone knows that cracking the top three for a search term dramatically boosts visibility. These "striking distance" keywords are your best shot at climbing the ranks with a little focused effort.
- Take Action: Now, go look at the top three clicked ASINs for those terms. What are they doing right? Is their main image more compelling? Is their price better? Tweak your listing based on what you find and create targeted ad campaigns to start stealing some of that click share.
By systematically finding these opportunities, you can shift your ad spend away from broad, low-performing terms and onto specific, high-intent keywords that actually deliver a return.
Crafting Irresistible Bundles with Market Basket Analysis
One of the quickest ways to boost revenue is to increase your Average Order Value (AOV). The Market Basket Analysis report is your secret weapon for doing this, as it reveals what your customers are naturally buying together.
This report shows you the top three products most frequently purchased at the same time as yours. It’s like getting a peek directly into your customer's shopping cart.
For example, a brand selling yoga mats might find that 30% of its customers also buy a specific set of yoga blocks and a water bottle in the same order. That's not a coincidence; it's a clear signal of what your customer really needs.
This data is the perfect starting point for creating strategic product bundles or smart cross-promotional campaigns.
- Create Virtual Bundles: Use the "Frequently Bought Together" feature on your product detail page to your advantage. If you sell a complementary item that shows up in this report, you can run ads targeting your own product pages to encourage that add-on purchase.
- Design Physical Product Bundles: Go a step further and create a brand new ASIN that bundles your main product with the top one or two complementary items. You can often offer a small discount on the bundle, making it an easy "yes" for shoppers and bumping up your AOV.
- Guide Your Product Development: Do you keep seeing customers buying a type of product you don’t even offer? That's a loud-and-clear sign of an unmet need within your audience. This insight could be the inspiration for your next big product launch.
Analyzing this data helps you shift from just selling a product to providing a complete solution for your customer.
Building Loyalty with Repeat Purchase Data
It can cost five times more to acquire a new customer than to keep an existing one. The Repeat Purchase Behavior report helps you focus on the more profitable side of that equation by showing you just how loyal your customers are.
This report breaks down how many of your orders come from first-time buyers versus repeat customers. A high or growing repeat purchase rate is a sign of a healthy brand with a happy, loyal following.
Here’s how to put that data into action:
- Identify Your "Loyalty Leaders": Sort the report by ASIN to see which products have the highest percentage of repeat purchases. These are your star products—the ones that delight customers so much they come back for more.
- Take Action: Feature these products more prominently in your Amazon Storefront and in your brand-focused Sponsored Brands campaigns. These are the items most likely to turn a new shopper into a lifelong fan.
- Segment and Retarget: Use this data to create targeted email campaigns (where possible) or other off-Amazon marketing efforts. For instance, you could create a special offer for customers who have purchased from you more than once, thanking them for their loyalty and giving them a reason to buy again.
Once you get a handle on these core reports, the next step is using the data to make smarter decisions that drive profit. To really sharpen your ability to predict future performance, you should explore resources on how to forecast sales and leverage data for growth. Putting these strategies into practice is what turns Amazon Brand Analytics from a simple reporting tool into a true engine for growth.
Common Mistakes to Avoid in Your Analysis
Having access to the treasure trove of data in Amazon Brand Analytics gives you a serious edge, but it's only half the battle. The real magic happens when you interpret that data correctly. Too many sellers stumble into the same traps, drawing the wrong conclusions and making costly mistakes.
Think of the data as a powerful but tricky tool. If you don't understand its quirks, it's like trying to navigate a new city with the map held upside down. You’ll definitely be moving, just probably in the wrong direction.
By steering clear of these common pitfalls, you’ll build a smarter, more effective approach to analysis. Your decisions will be grounded in solid insights, not flimsy assumptions, which is exactly what you need for long-term growth.
Focusing Only on High-Volume Keywords
It’s so tempting. You see a keyword with a massive search volume and immediately want to pour all your ad budget into it. But this is almost always a mistake.
Those big, broad keywords are often packed with window shoppers who have zero intention of buying anything just yet. Chasing these "vanity" metrics will drain your budget fast without bringing in the sales to show for it. Someone searching for "blender" is just browsing; someone searching for "quiet personal blender for smoothies" is ready to pull out their credit card.
Smarter Alternative: Forget search volume for a minute and focus on Conversion Share. Find the keywords where you can realistically grab a big piece of the sales pie. Even if the search volume is lower, these are the terms that actually make you money.
Misinterpreting Market Basket Data
The Market Basket report is a goldmine for finding great bundle and cross-selling ideas. But a classic blunder is thinking that just because two products are frequently bought together, they’ll make a perfect bundle. Correlation isn't always a strategic green light.
For instance, your report might show customers often buy your gourmet dog food with a popular brand of flea collars. That's interesting, but does bundling them make sense? Probably not. The flea collar is a routine purchase, not an exciting add-on that enhances your brand's story.
Here's a better way to think about it:
- Look for logical pairings: Find products that genuinely improve the customer’s experience with your main item.
- Think actionably: If you sell a high-end French press and see customers constantly buying a specific coffee grinder with it, that’s a flashing sign to create a "Perfect Morning Coffee Kit" bundle.
- Ensure a strategic fit: The best bundles feel natural and solve a complete problem for the buyer. It's about more than just mashing two popular products together. For a deeper dive on how this fits into the bigger picture, check out our guide on how to track Amazon sales.
Making Decisions Based on Short-Term Data
The data in Brand Analytics can swing wildly from day to day. A competitor's flash sale, a holiday weekend, or a sudden stockout can create temporary spikes and dips. A huge mistake is overreacting to a single bad day or a surprisingly good week.
Seeing your click share for a top keyword suddenly tank can be alarming. But before you panic and rework your entire strategy, take a breath. It could just be a one-day fluke caused by a competitor's lightning deal. Making a knee-jerk change to your pricing or ad strategy based on a blip is a recipe for disaster.
Instead, always look at trends over a meaningful period. Analyze your data over the last 30, 60, or 90 days to spot the real patterns. This approach filters out the daily noise and gives you a much clearer, more reliable picture of what’s actually going on.
Frequently Asked Questions
Even with a comprehensive guide like this one, some questions always pop up once you start digging into a new tool. We've compiled the most common questions sellers have about Brand Analytics to clear up any lingering confusion.
Think of this as the final piece of the puzzle, giving you the clarity you need to dive in and start analyzing with confidence.
How Often Is Brand Analytics Data Updated?
This is usually the first thing people ask. After all, you need to know if you're looking at yesterday's numbers or last week's trends to make good decisions. For most reports in Brand Analytics, the data is updated within 72 hours.
This means you’re typically looking at customer behavior from one to three days ago. Amazon needs this slight delay to process the massive amount of data it collects. It's a small detail, but an important one to remember, especially if you're trying to measure the immediate impact of a price change or a brand-new ad campaign.
The real power here is in tracking trends over time, not reacting to daily blips. A 72-hour refresh rate is perfect for strategic analysis, helping you spot meaningful patterns instead of getting sidetracked by short-term noise.
Can I See My Competitors' Specific Sales Data?
This one is a hard no—and for good reason. Amazon Brand Analytics is built to give you incredible competitive insights while fiercely protecting every seller's private data. You'll never see a competitor's exact sales numbers, revenue, or profit margins.
So, what can you see? You get access to aggregated and anonymized data. For instance, the Search Query Performance report shows you:
- The top three most-clicked ASINs for a specific search term.
- The total click share and conversion share for each of those top products.
This lets you see exactly who you're up against for your most important keywords and benchmark your performance against theirs, all without crossing any privacy lines. It’s the perfect balance of competitive intelligence and data protection.
Is Brand Analytics Available in All Amazon Marketplaces?
If you sell internationally, this is a big one. The good news is that Amazon has rolled out Brand Analytics to most of its major marketplaces. As long as you're enrolled in Brand Registry in a particular country, you should have access to the analytics for that region.
This includes key markets like:
- North America (USA, Canada, Mexico)
- Europe (UK, Germany, France, Italy, Spain)
- Asia (Japan, India, Australia)
Keep in mind that availability can sometimes lag in smaller or newer marketplaces. The easiest way to check is to log into Seller Central for each country and look under the "Brands" tab. If Brand Analytics is available, you'll find it there. Using this regional data is crucial for tuning your listings and ad campaigns to match local shopping habits.
How Does Brand Analytics Differ from Business Reports?
It's easy to get these two mixed up. Both are in Seller Central and offer valuable data, but they tell you very different things.
Here’s a simple analogy: Business Reports are like your car's dashboard—they tell you about your speed, fuel level, and engine temp. Brand Analytics is like a high-tech GPS showing you city-wide traffic patterns, popular routes, and where your competitors are heading.
Business Reports
This is all about your own account's performance. It shows your sessions, page views, and conversion rates for your products. It answers the question, "How are my listings doing?"
Brand Analytics
This gives you the bigger picture of customer behavior across the entire marketplace. It’s focused on how shoppers are searching for products (yours and your competitors'). It answers strategic questions like, "What are people actually searching for, and who is winning their clicks?"
Here’s a quick comparison:
| Feature | Business Reports | Brand Analytics |
|---|---|---|
| Focus | Your individual seller account | Overall market & customer behavior |
| Scope | Internal performance metrics | Competitive & search trend insights |
| Key Data | Sessions, sales, conversion rates | Search terms, click share, demographics |
| Main Use | Monitoring your own sales funnel | Strategic planning & market research |
They work best together. Business Reports might tell you that your sales dropped, but Brand Analytics can help you figure out why—like discovering a competitor just stole your top spot for a critical keyword.
Ready to turn your influencer collaborations into a predictable, scalable growth channel? Coral provides the ultimate affiliate management platform built exclusively for Amazon sellers. Recruit, track, and pay your brand ambassadors with a system designed to drive word-of-mouth growth and maximize your revenue. Start for free and build your affiliate army today!